
Gap Trading: Key Insights for Investors
Gap-ups indicate positive market sentiment and trigger buying, while gap-downs suggest negative news leading to panic selling. Understanding these concepts aids informed trading decisions.
no comments

Understanding Candlestick Charts for Traders (Part 10 of 10): The 5 GOLDEN RULES of Candlestick Analysis
This final part outlines five essential rules for candlestick analysis, guiding traders in managing risks and making informed trading decisions effectively.
no comments
Understanding Candlestick Charts for Traders (Part 9 of 10): Unveiling Bullish & Bearish Heremi Patterns
The Bullish and Bearish Heremi candlestick patterns indicate potential trend reversals in markets, providing traders insights to enhance decision-making and trading strategies.
no comments

Understanding Candlestick Charts for Traders (Part 8 of 10): TWEEZER Patterns
TWEEZER patterns highlight potential trend reversals in the market, with TWEEZER TOPs indicating bearish shifts and TWEEZER BOTTOMs suggesting bullish movements.
no comments
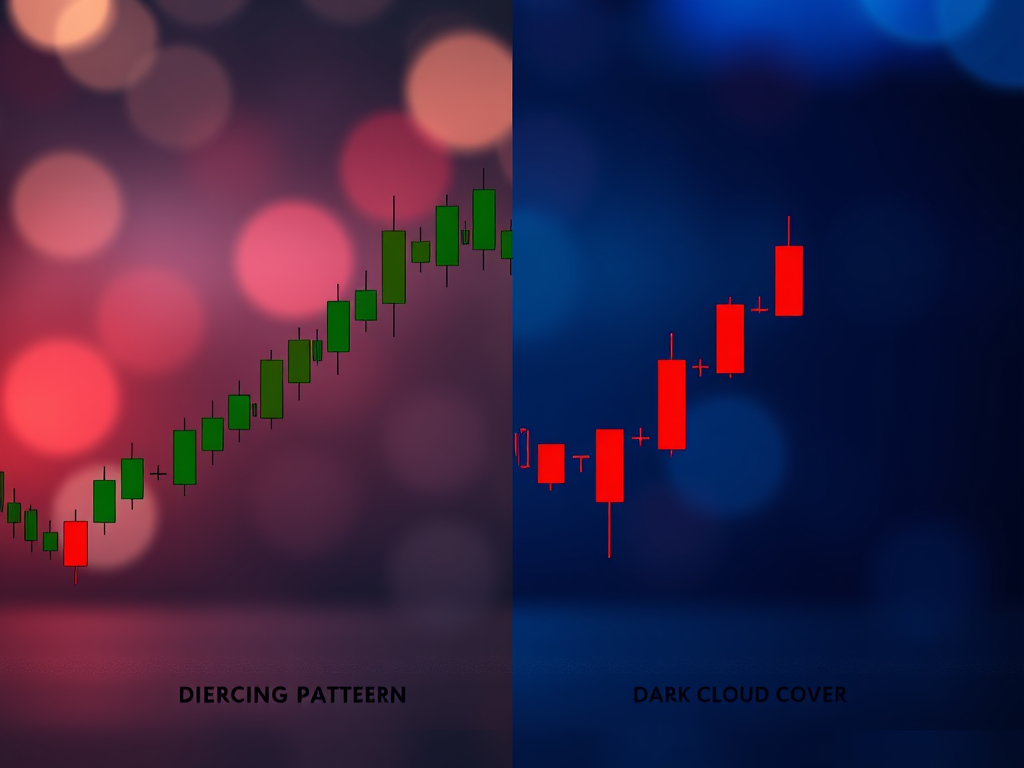
Understanding Candlestick Charts for Traders (Part 7 of 10): Piercing & Cloud Cover Patterns
This analysis focuses on Piercing and Dark Cloud Cover patterns, revealing their significance as potential bullish and bearish reversal signals in trading contexts.
no comments

Understanding Candlestick Charts for Traders (Part 6 of 10): STAR pattern
The Morning and Evening STAR patterns are essential candlestick indicators of potential bullish and bearish reversals, guiding traders in market trend analysis.
no comments

Understanding Candlestick Chart for Traders (Part 5 of 10): ENGULFING Pattern
Engulfing candlestick patterns signal potential market reversals, with Bearish indicating a downside shift and Bullish suggesting an upward trend. Recognizing these patterns aids traders.
no comments

Understanding Candlestick Charts for Traders (Part 4 of 10): Hammer Candle – Key to Market Reversal
The Hammer candle indicates market resilience and potential reversals, suggesting shifts between bearish and bullish sentiment. Recognizing this pattern can enhance trading strategies and decision-making.
no comments

Understanding Candlestick Charts for Traders (Part 3 of 10): Unveiling the Enigmatic DOJI Candle
The DOJI candlestick indicates market indecision, signaling potential trend reversals. Traders should observe subsequent candlesticks for confirmation of market direction.
no comments
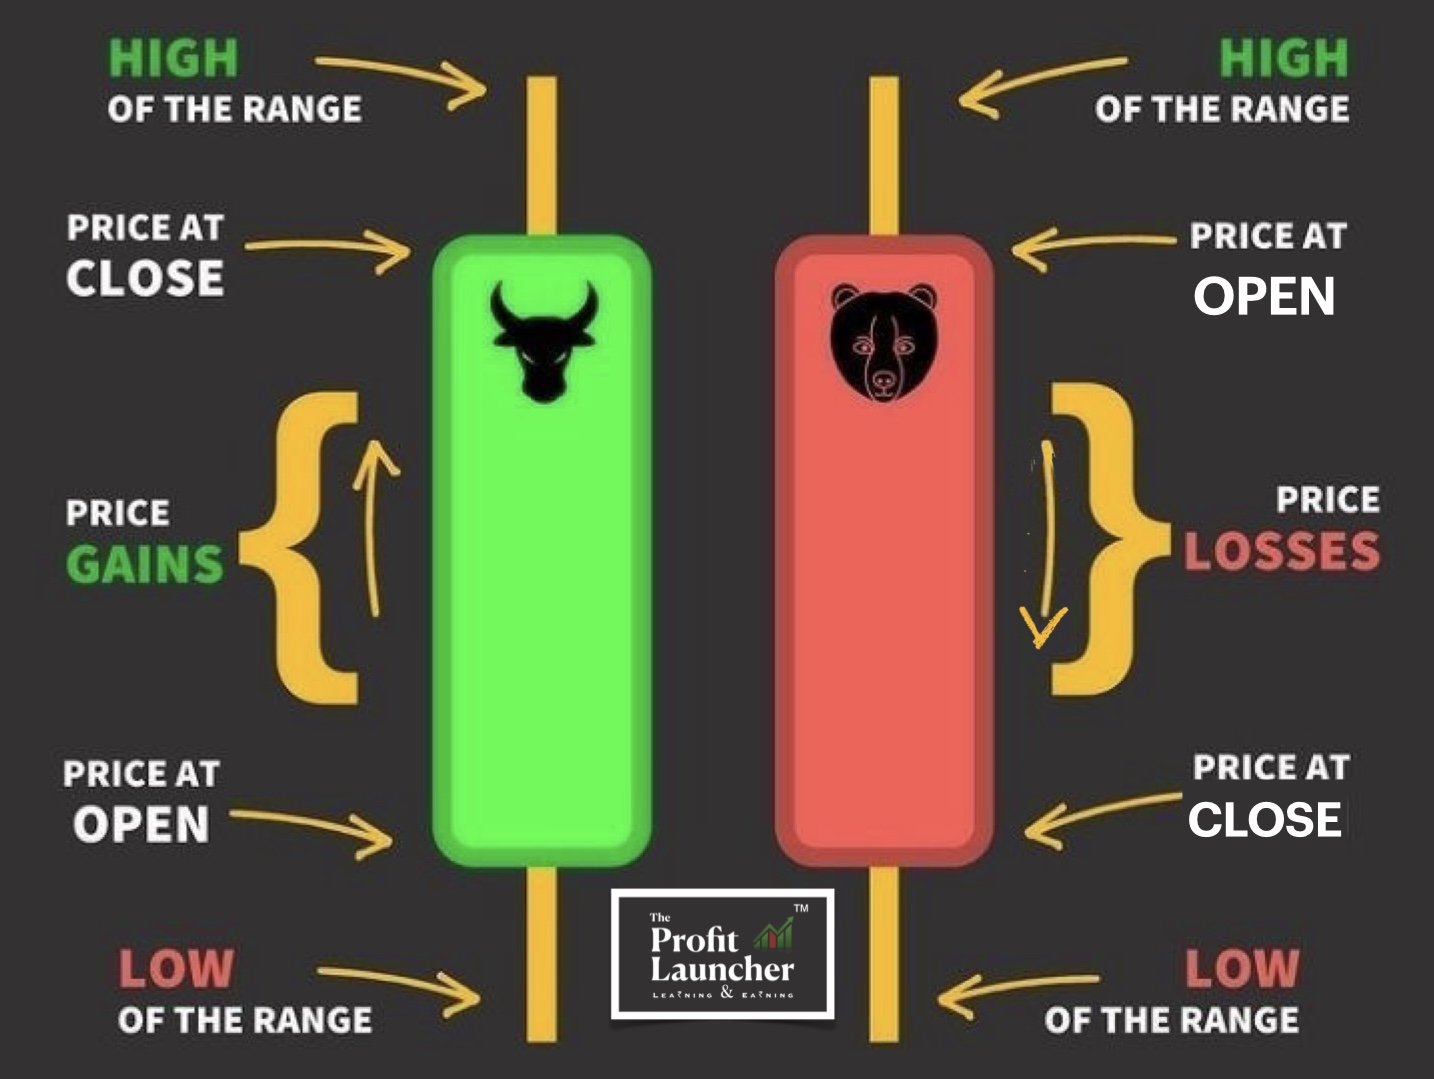
Understanding Candlestick Charts for Traders (Part 1 of 10) – Candle Anatomy
Candlestick charts depict price movements, indicating market sentiment with body colors and wicks that reveal highs and lows.
no comments