
Tag: learn stock market

Understanding Candlestick Charts for Traders (Part 8 of 10): TWEEZER Patterns
TWEEZER patterns highlight potential trend reversals in the market, with TWEEZER TOPs indicating bearish shifts and TWEEZER BOTTOMs suggesting bullish movements.
no comments
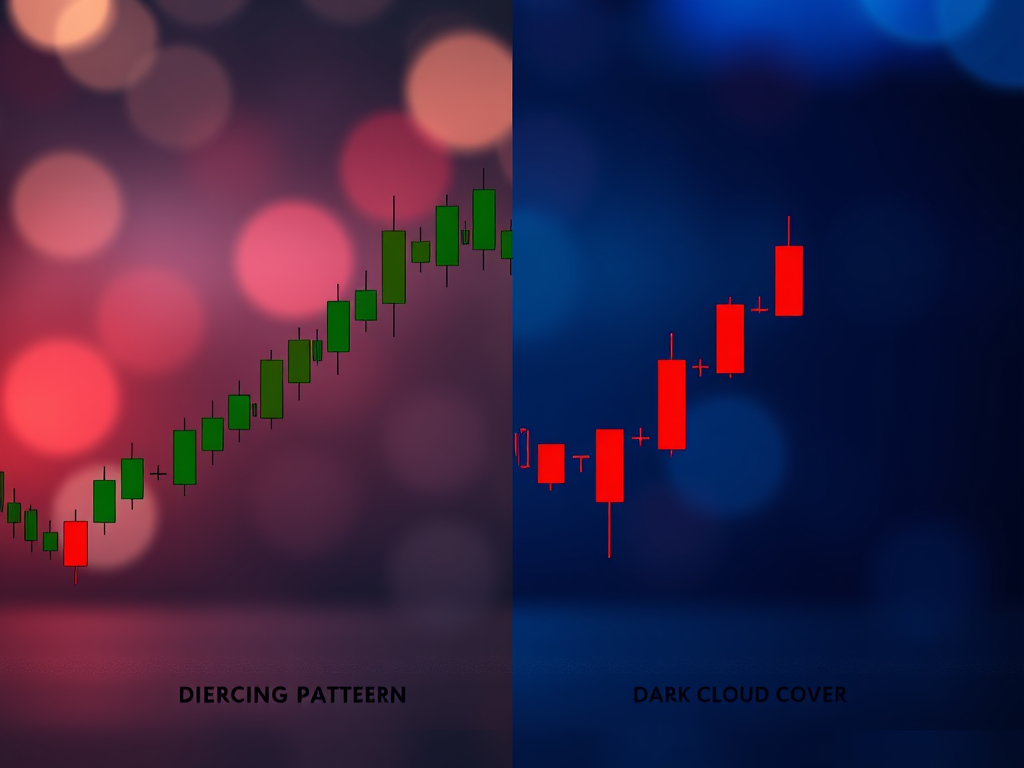
Understanding Candlestick Charts for Traders (Part 7 of 10): Piercing & Cloud Cover Patterns
This analysis focuses on Piercing and Dark Cloud Cover patterns, revealing their significance as potential bullish and bearish reversal signals in trading contexts.
no comments

Understanding Candlestick Charts for Traders (Part 6 of 10): STAR pattern
The Morning and Evening STAR patterns are essential candlestick indicators of potential bullish and bearish reversals, guiding traders in market trend analysis.
no comments

Understanding Candlestick Chart for Traders (Part 5 of 10): ENGULFING Pattern
Engulfing candlestick patterns signal potential market reversals, with Bearish indicating a downside shift and Bullish suggesting an upward trend. Recognizing these patterns aids traders.
no comments

Understanding Candlestick Charts for Traders (Part 4 of 10): Hammer Candle – Key to Market Reversal
The Hammer candle indicates market resilience and potential reversals, suggesting shifts between bearish and bullish sentiment. Recognizing this pattern can enhance trading strategies and decision-making.
no comments

Understanding Candlestick Charts for Traders (Part 3 of 10): Unveiling the Enigmatic DOJI Candle
The DOJI candlestick indicates market indecision, signaling potential trend reversals. Traders should observe subsequent candlesticks for confirmation of market direction.
no comments
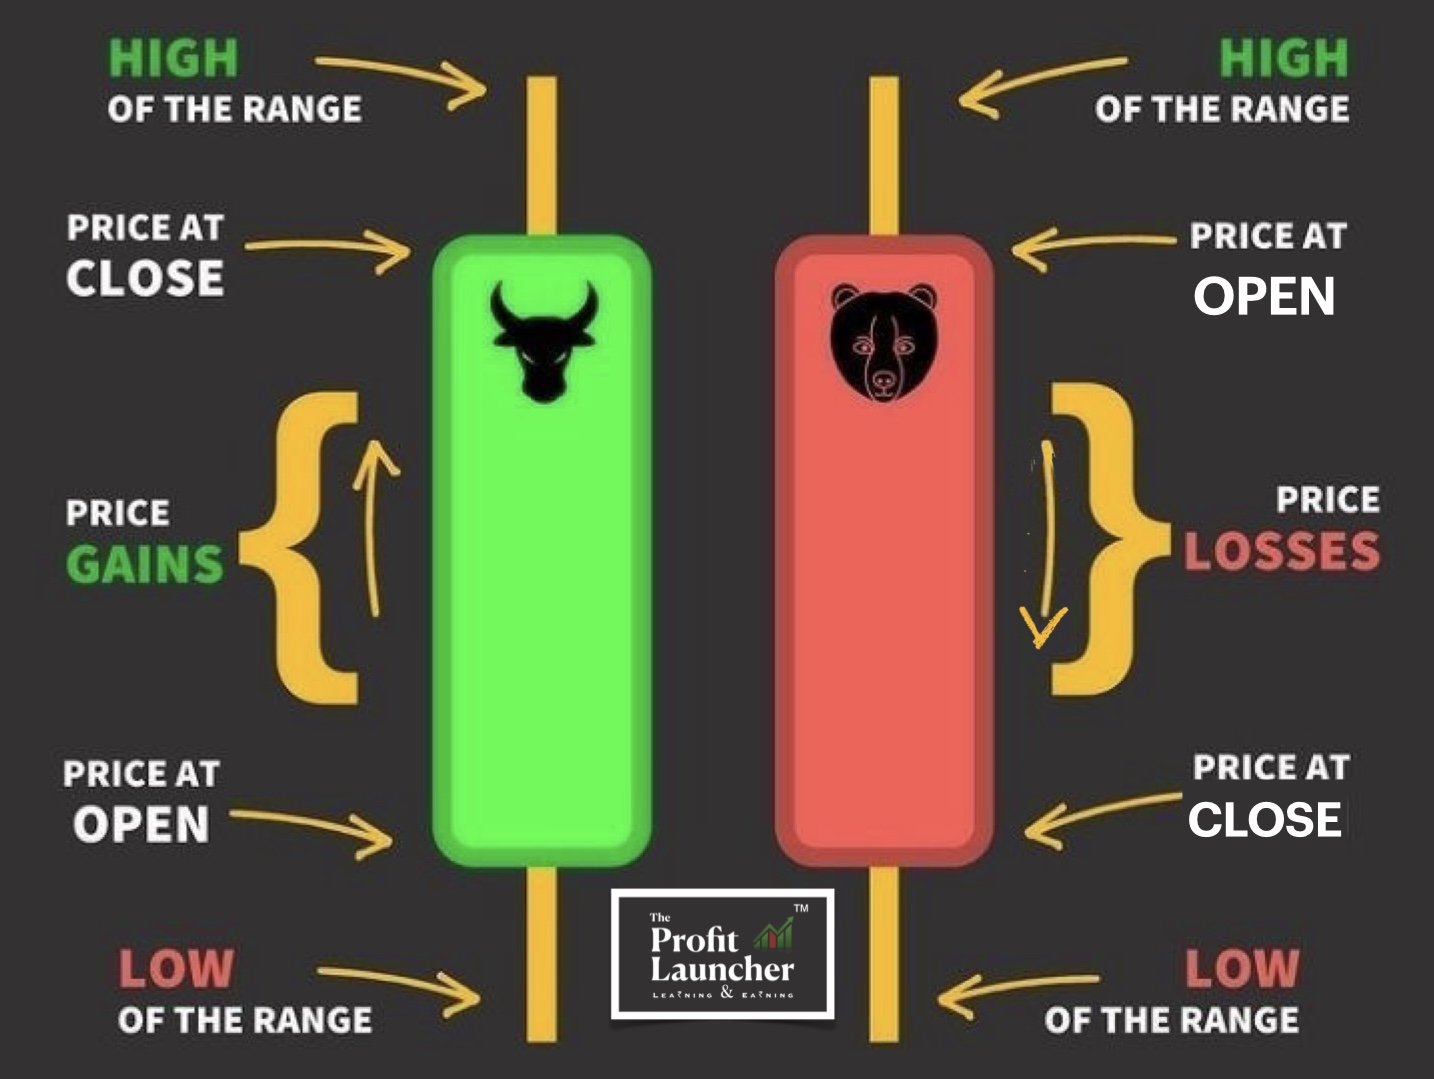
Understanding Candlestick Charts for Traders (Part 1 of 10) – Candle Anatomy
Candlestick charts depict price movements, indicating market sentiment with body colors and wicks that reveal highs and lows.
no comments

Understanding Open Interest: A Simple Guide
Open interest represents outstanding contracts and indicates market activity. It helps traders understand liquidity, confirm trends, and identify potential reversals in trading.
no comments
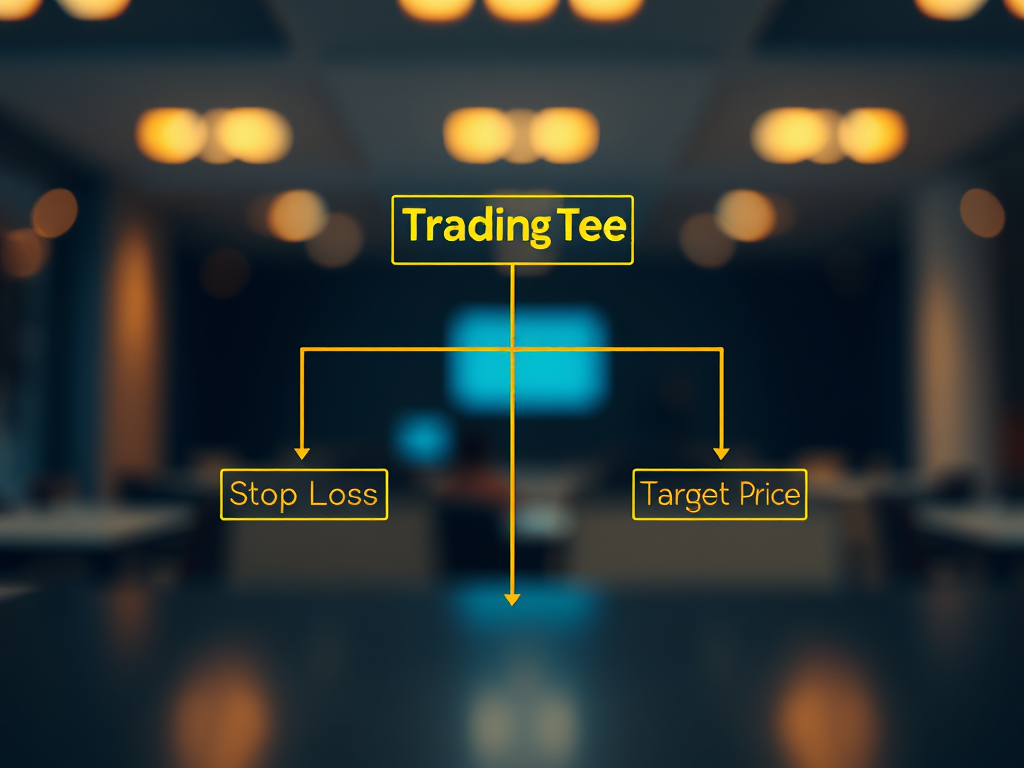
TRADING TREE: A Visual Approach to Trading with Risk Management
Trading Tree simplifies trading by managing risk through predetermined Stop Loss and Target Price. It guides users in creating effective trades and refining strategies based on outcomes.
no comments
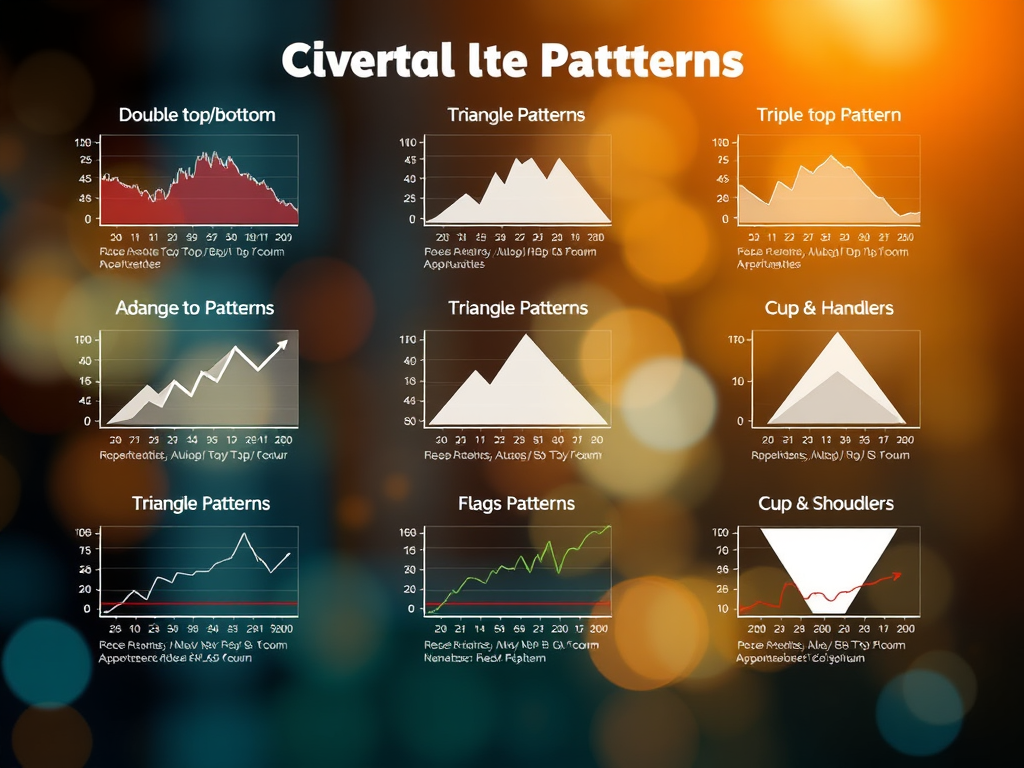
Top Chart Patterns Every Trader Must Know
Are you looking to take your trading game to the next level?Proper understanding of Chart Patterns can be a game-changer! Here are some key patterns every trader should know:
no comments